Catch me if you can
NSW Health - infamous for manipulating COVID data - did it again. We caught them - again.

Here we go again. NSW Health, whose vaccine data is curated by the infamous $65m bionic vaccinologist1 Kristine Macartney’s group NCIRS (who obviously have no interest at all in making sure people swallow the government line even if it results in a huge death toll), have been caught with their hands in the COVID cookie jar. Again.

What do I mean by that? Well, they fixed the figures to make the COVID vaccines look better than they were - far better, in fact. Before I show you what they did this time, it’s worth reminding you what they did last time, which I posted here:
Except it wasn’t just that one, here’s another one:
Anyway let’s get down and dirty with the data. Today we are looking at the January 2022 vaccine surveillance reports from NSW health. They archived them but in case they disappear, don’t worry we have copies.
What happened was that NSW Health did exactly what the UKHSA did when the data for COVID vaccine efficacy got so embarrassingly bad that they could no longer hide it - they stopped reporting it. These were the per-100,000 case rates by vaccination status in the infamous UKHSA week 13 report:
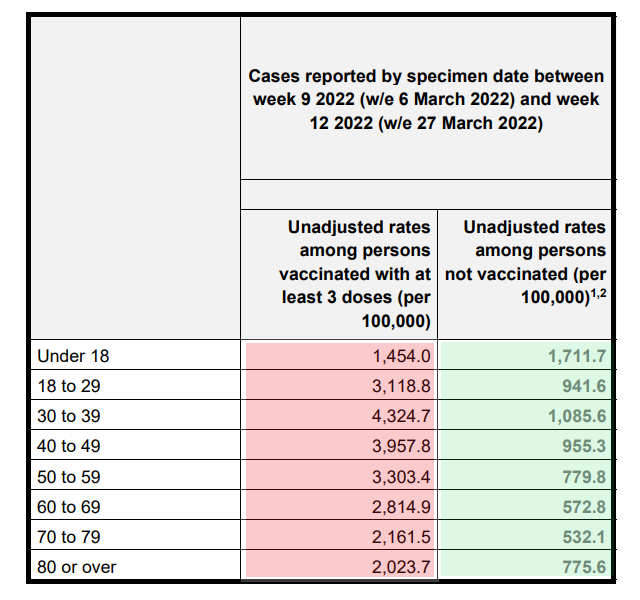
Readers who are on-the-ball will know that you can (should) calculate the efficacy of a vaccine by the tried and trusted (old school) method still published on the CDC website (yes that’s archived too)
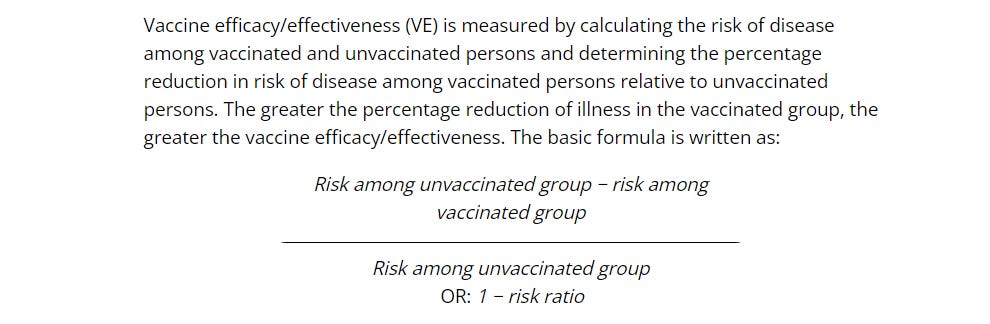
In simple terms, if you halve the risk (per 100,000 population) of catching a disease after a vaccine the vaccine effectiveness is 50%. If you have double the risk (e.g. because it’s a really shitty vaccine for the wrong epitope and destroys your immune system because of T-cell exhaustion) the vaccine effectiveness is -100% (negative 100%). We didn’t learn much about negative vaccine efficacy in medical school because it wasn’t a thing. It only really became a thing after Dengue and the Adenovirus HIV vaccine. And yes, that adenovirus vector that increased the risk of getting HIV was similar to the Astrazeneca COVID vaccine vector.
Obviously the AZ vaccine was completely different and was super good at preventing infection, because the government (aka Sarah Caul and Vahe Nafilyan from the UK ONS, who don’t have a bias at all, honestly) said so. In fact, Sarah Caul who leads the ONS COVID-19 unit did such sterling work whitewashing the COVID vaccine data (which we are not allowed to see) she got an MBE. Go figure.


So now we have a little bit of a problem. If you look at any of those age groups in the UKHSA report above (the only bit of “raw” data2 that we were allowed access to) you will see a negative vaccine efficacy for all age groups other than under 18, exceeding -300% for most others.
If you want to check this yourself just divide the difference in the case rates per 100,000 by the case rate in the unvaccinated. This is what you get:
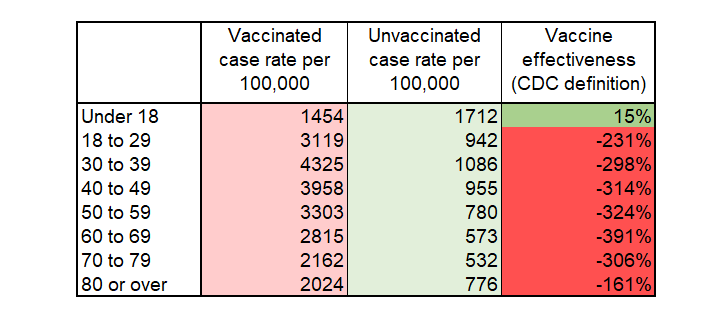
Of course, this negative efficacy (actually effectiveness because that is the word used to describe the efficacy in the general population) could be even worse by now, and we won’t know because they stopped reporting the case rates.
Now, there is another way of calculating efficacy if you don’t have the case rates per 100,000 in each group. You can estimate it from comparing the case rates that you see in the infected population (vaccinated vs unvaccinated) against the proportions vaccinated vs unvaccinated in the general population.
It’s called a “test negative design” and it’s a great tool for e.g. the flu vaccine manufacturers to sell their (completely useless) products. There are a bunch of problems with this design and one of the biggest is the concept that unvaccinated people might be tested more, so biasing the outcome. There are a heap of reviews on the limitations of this metric but here’s just one:

I’m going to be generous here because the people involved in generating the propaganda at NSW health include "COVID tyrant" Bradley Hazzard, MP, the NSW health minister who thinks he has done a great job in overseeing the increase in COVID deaths 100-fold during his mandate tenure. Apparently he is so upset by the criticism of his regime that he has not only resigned but taken mental health leave3. I hope he gets better so that he can reflect on what he did when he recreated the Warsaw Ghetto in Sydney in August 2021.

Now, in order to calculate the vaccine efficacy in a test-negative design it’s a little bit more complicated. What you need to do is compare the difference between the population rates of vaccination and the sample (infected) rate of vaccination. Once you have these you can calculate the efficacy using the formula:
1-((Vx/Ux)*(PUx/PVx))
Where
Vx = % of infected who are vaccinated
Ux = % of infected who are unvaccinated
PUx = % of population who are unvaccinated
PVx = % of population who are vaccinated
So, armed with this we turn to the NSW health data set for the time period up to 8th January 20224. This is a special data set because it was basically collated over Christmas (when most people in NSW have time off) and so they didn’t have chance to check with Professor Macartney that they could release the data. And what a great data set it was:
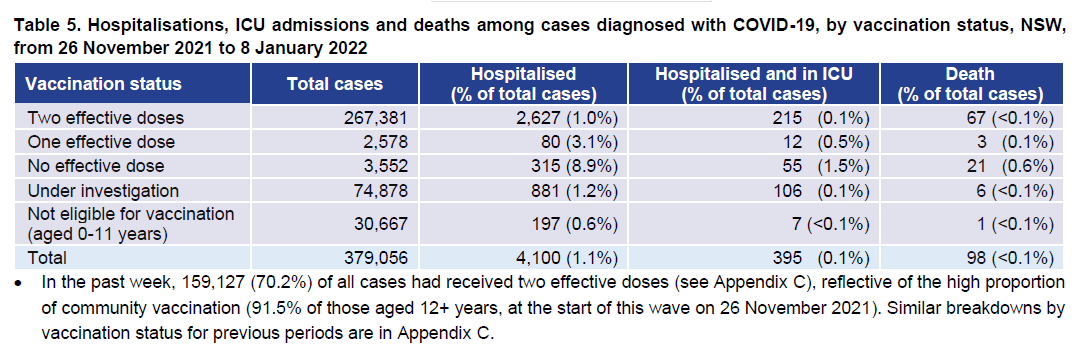
From these figures you can see that the total infected population where the vaccine status was known (and eligible) was 267,381+2578+3552 = 273,511. This gives an unvaccinated or 1-dose rate of 2.2%. At the same time the (presumably 2+ dose) vaccination rate of 12+ years (i.e. the same group) was 91.5%.
If we plug that into our formula above we get a negative vaccine efficacy of 313%:
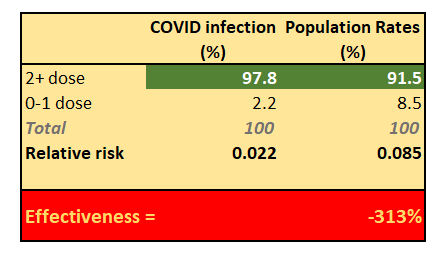
Which is absolutely consistent with the cohort-derived vaccine effectiveness seen in the UKHSA report.
But… what happened next is a shocker. At the time of the report (end of January 2022) the TGA “approved” the COVID vaccines for use in under-12s. There weren’t actually that many people crazy enough to enrol their under-12 child to an uncontrolled trial of an mRNA therapy for a disease they weren’t at any significant risk from but that didn’t matter.
Despite the small numbers subjecting themselves to this treatment, NSW health decided they should move all the historical children’s COVID infection numbers into the unvaccinated group. Because they were suddenly no longer “ineligible” - get it?
To illustrate the point here are the children’s infection numbers for the week ending 15th Jan (the week of the change in eligibility)5
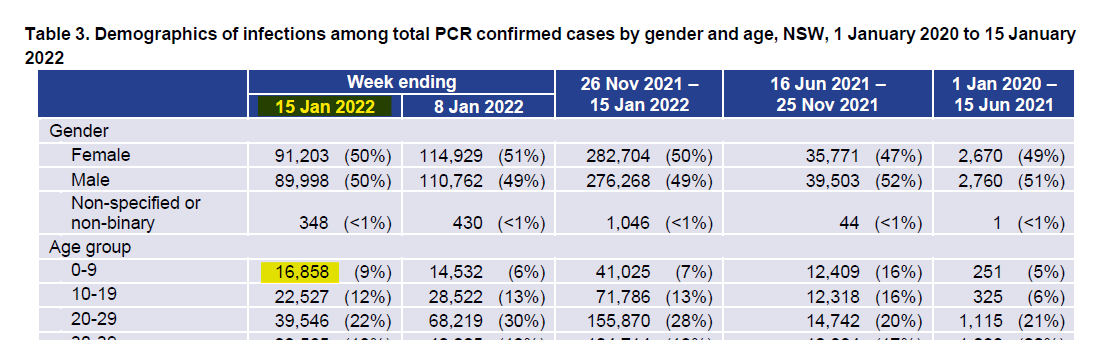
This gives us an estimated 21,363 new childhood cases (16858 + 20% of 22527 to account for the under 12’s i.e. 10-11 age group). In the previous week there were 30,667 in the “ineligible” category. Combining these gives us 52,030 cases that would have been separated out in the previous week’s composition.
Now let’s look what happened for the week ending 15th January report:
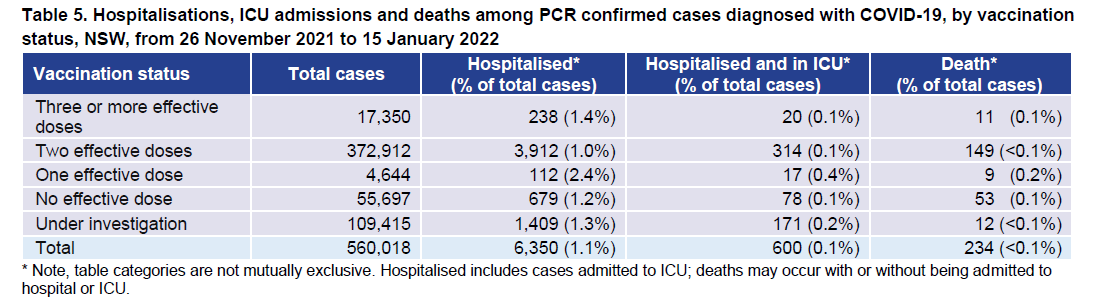
The “no effective dose” i.e. unvaccinated has jumped from 3,552 cases to 55,697 cases in one week. Instead of 2.2% of the known status cases the 0-1 dose group becomes 13.4% - a massive jump and pushing the “vaccine effectiveness” into positive territory again.
Of course this is totally fraudulent reporting:
The new cases were 52,145 in the “unvaccinated” group but as outlined above there were actually 52,030 cases “transferred” from the ineligible category. Essentially all the new cases in the unvaccinated group were artificially inflated by transfer from the ineligible category.
Here’s the rather pathetic and disingenuous explanation from NSW health at the time:
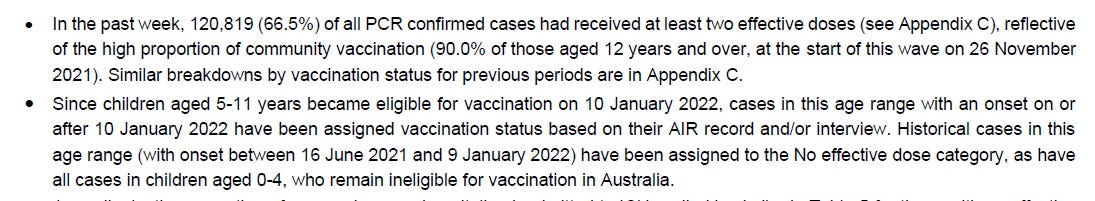
In their explanation they are saying something like “muh… 66% of cases were in the vaccinated but 90% of the community were vaccinated, which is higher, so the vaccine is working”. What they should have said - if they weren’t misrepresenting their own data - is “of the cases where we know the vaccination status in those aged over 12, 96% were fully vaccinated but only 90% of the population was, so the risk of infection after vaccination seems to be higher”.
You literally can’t make this up. In order to make their terrible (negative) vaccine efficacy against infection look OK again they moved a whole category of childhood infections into the unvaccinated group - irrespective of when they were infected and whether they had a vaccine.
And, of course they continued with this same disingenuous reporting until the next time that they couldn’t contain their embarrassment any longer. Because, it seems, that’s what the NSW health Department of Vaccinology™ does.
This is of course a variation on the merry dance that the UK’s ONS did when they under-represented the proportion of of the population who were unvaccinated, completely inverting the resulting vaccine effectiveness. Covered nicely in Norman Fenton’s interview by John Campbell, which surprisingly is still up on Youtube.


The main difference here being that NSW health deliberately moved a whole category of cases from the “ineligible” to the “unvaccinated” group to push a narrative. And it wasn’t the first time they did it.
Catch me if you can. Great work if you can get it, eh?

Prof Macartney got her qualifications as a vaccinologist by attending a two week pharma-sponsored course in Switzerland. There is no Royal College of Vaccinology - it’s a self declared qualification. It’s a bit like doing a course in chocolate making and calling yourself a chocolatologist. No, literally that’s what it’s like. For interest these are the “partners” of the Institut Merieux course Kristine Macartney attended:
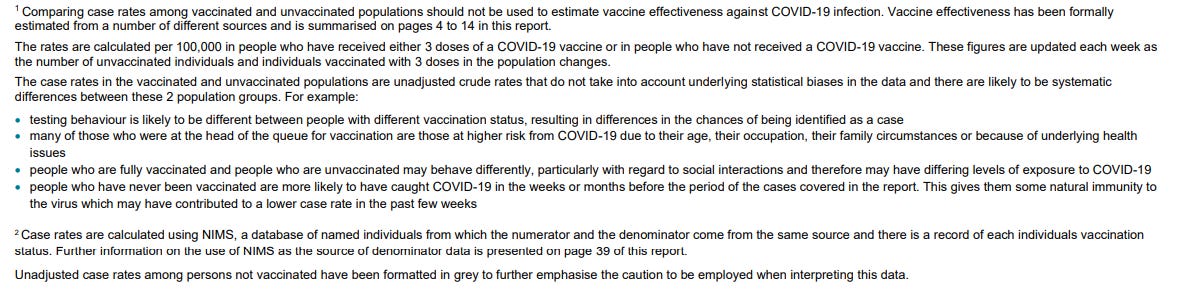
The case rate per 100,000 population is pretty much the only unadulterated part of the vaccine surveillance reports and was hidden further and further back in the tables until it was unpublished altogether. All other tables in the UKHSA reports, like the NSW reports, are curated to within an inch of their lives. The UKHSA case rates became such an embarrassment that the UKHSA had to write a whole page of explanation to try and explain why the case rates were so bad, but it was complete baloney. In the interests of transparency I post the baloney below (from page 45 of the report).
The suggestion in the tweet is that Hazzard’s need for a holiday was related to his performance as a deranged bully in the NSW senate hearings which can be seen here: https://t.me/arkmedic/6227
No comments:
Post a Comment